
Fibre signal anomalies
ONTs with an unstable signal or intermittent micro-drops: the loose connector or the badly made splice that in two weeks will be a fault and a site visit.
The NOC watches, on its own, the routers, nodes, links, access points and OLTs you already have on the system: nobody has to tell it what to look at. And it does not stop at warning you about what has already dropped — it shows you the fibre going bad, the box running out of ports and the uplink heading for saturation, with the estimated date.
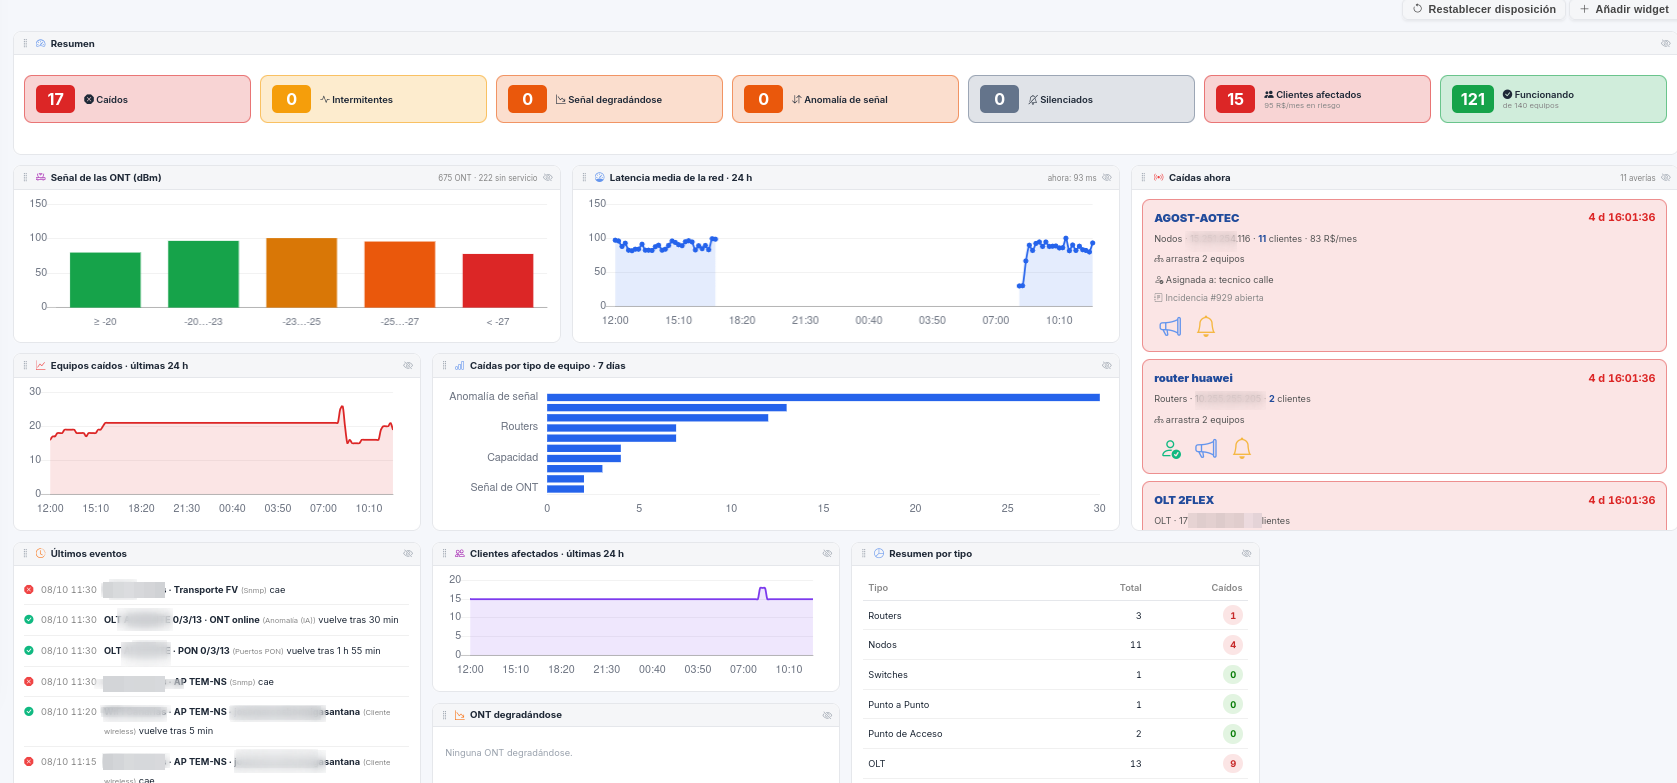
Anyone can see an outage: the customer calls. What costs money is what is slowly going wrong and nobody is looking at.
ONTs with an unstable signal or intermittent micro-drops: the loose connector or the badly made splice that in two weeks will be a fault and a site visit.
It compares each connection's real signal against its theoretical optical budget and flags the ones losing too much. Plus power by area, to see when a whole PON port drops.
OLT temperature and CPU, uplink usage: the NOC projects the trend and tells you what is heading for its limit andwhen it will get there.
Each metric learns how it normally behaves at each hour of the day. A node carrying four in the morning's traffic at four in the afternoon breaks no threshold, but something is wrong with it.
If your public IPs land on a blacklist, your customers' e-mail starts bouncing and nothing looks wrong on your network. The NOC watches them every night, and that your DNS keeps answering too.
Subscribers with the traffic patterns of an infected device: sending spam directly, connections to abuse ports or port sweeps. That is what ends up putting your IPs on those blacklists.
Usage of boxes and PON ports, the fullest first, and a warning when a box is nearly out of room. So you do not sell coverage where nobody else fits.
The outages and recoveries the equipment writes to syslog, without the noise of everything else.
A business customer demands the month's SLA. A court order arrives asking who was using an IP at a specific time. Two pieces of paper that cost an afternoon each, and the NOC issues them on its own.
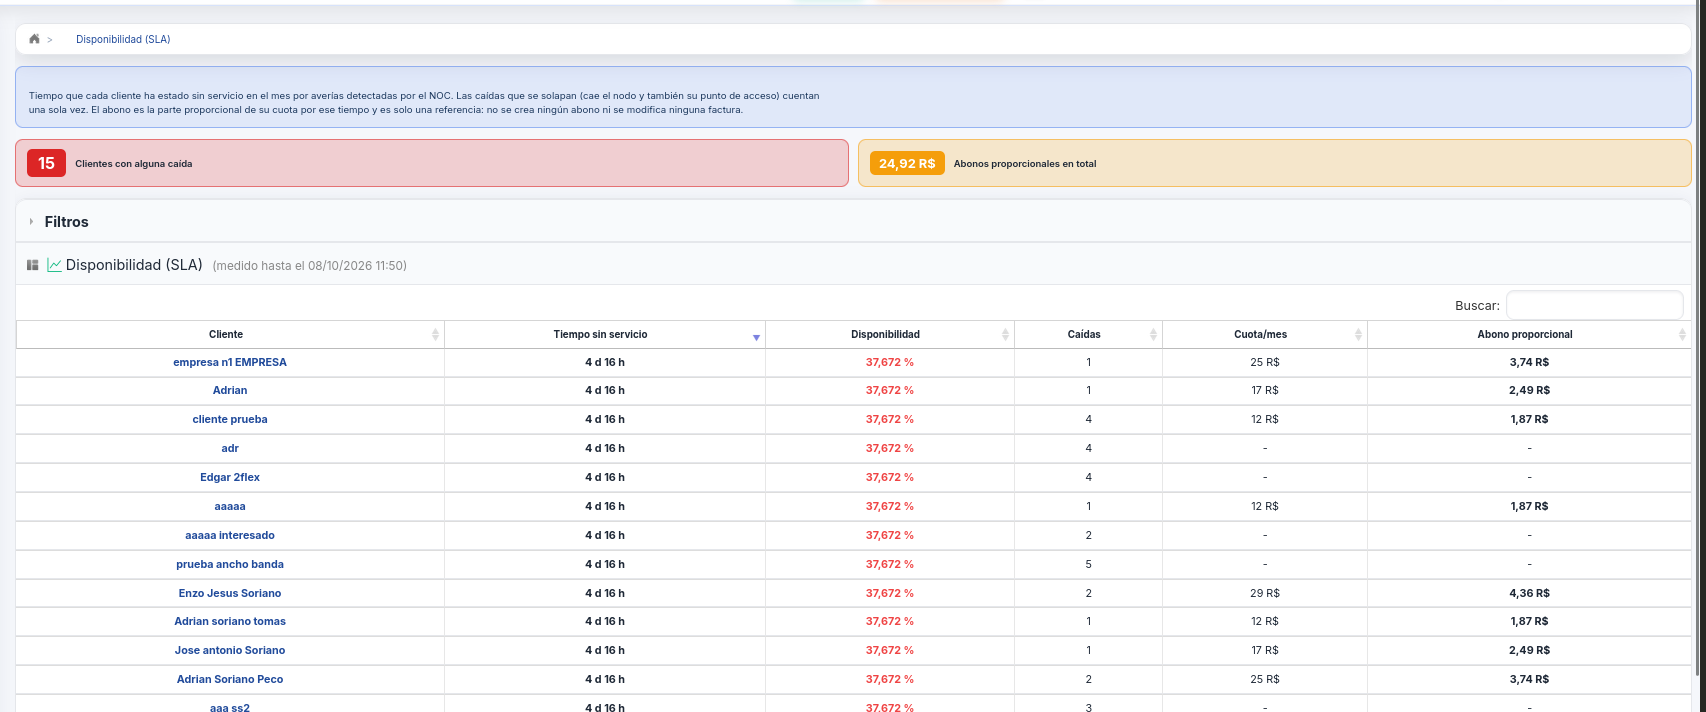
How long each customer has been out of service because of faults the NOC itself detected, and the proportional part of their fee that would correspond. Overlapping outages — the node drops and its access point with it — count only once.
The credit is a reference: no credit note is created and no invoice is touched. And the report can be scheduled to go out by e-mail every day, week or month.
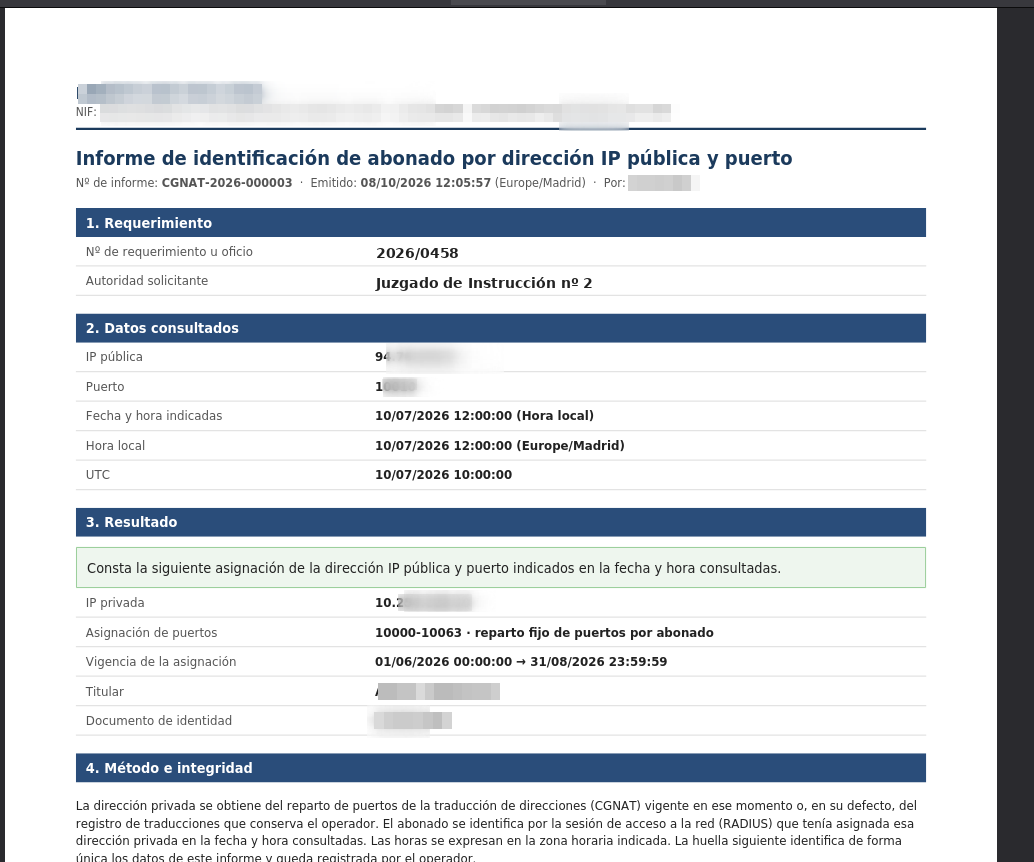
With CGNAT many customers go out through the same public IP, so the question «who was using IP X, port P, at such a time?» cannot be answered by looking at the router. Here you type the IP, the port and the time — local or UTC, as the requests usually arrive — and the subscriber comes out.
Underneath the result you put the file number and the authority, and the PDF report is generated. If there is no result, the report says so: that is a valid answer too.
Public IP to subscriber translations are kept compressed for as long as you configure — 365 days by default — consolidated by session, not by minute.
Each report carries its sequential number, a fingerprint of its data and a copy of the PDF, so you can prove afterwards that it has not been altered.
You plan the works window and during those hours the chosen equipment does not raise alerts. Planned works stop looking like a fault.
Las averías no esperan a que estés sentado. El NOC se consulta desde el móvil, y si
prefieres no entrar siquiera, se le pregunta al bot de Telegram: escribes
/estado o /caidos y contesta al momento, solo a quien esté
vinculado.
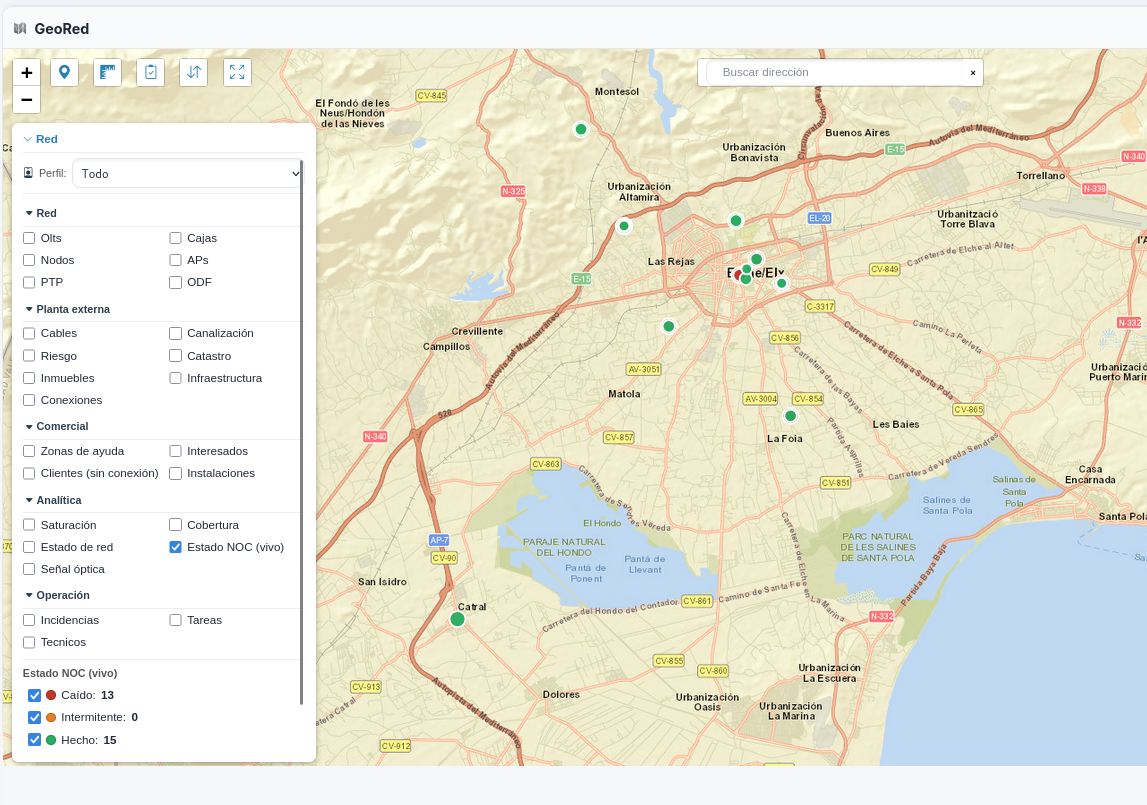
The NOC takes the routers, nodes, switches, links, access points and OLTs you already have on WispControl and checks them by itself. Each at its own pace:
| What | How it is read | How often |
|---|---|---|
| Network equipment | Ping | 1 minute |
| MikroTik routers | Router API | 2 minutes |
| OLTs, PON ports, boxes and ONTs | SSH to the OLT (Huawei, ZTE) or the FELIX API (Alea) | 5 minutes |
| SNMP equipment and access points | SNMP v1, v2c or v3 | 5 minutes |
| Internet health and optical health | Checks from the server | Every night |
And it does not multiply the messages: when a node drops and everything hanging off it with it, the alert talks about the cause and the rest appear as dragged down.
How many of these can you see on your network today?Half an hour, with your equipment and your OLTs in front of you.
Book a demo